Factsheets
If mineral resource stocks were evaluated more dynamically, they could be utilized more effectively by society.
Carbon Footprint Factsheet

“A carbon footprint is the total greenhouse gas (GHG) emissions caused directly and indirectly by an individual, organization, event or product.” 1 It is calculated by summing the emissions resulting from every stage of a product or service’s lifetime (material production, manufacturing, use, and end-of-life). Throughout a product’s lifetime, or lifecycle, GHGs may be emitted, such as carbon dioxide (CO₂), methane (CH₄), and nitrous oxide (N₂O), each with a greater or lesser ability to trap heat in the atmosphere. These differences are accounted for by the global warming potential (GWP) of each gas, resulting in a carbon footprint in units of mass of carbon dioxide equivalents (CO₂e). See the Center for Sustainable Systems "Greenhouse Gases Factsheet"for more information on GWP. A typical U.S. household has a carbon footprint of 48 metric tons (t) CO₂e/yr. 2
Sources of Emissions
Food (See U.S. Food System Factsheet)
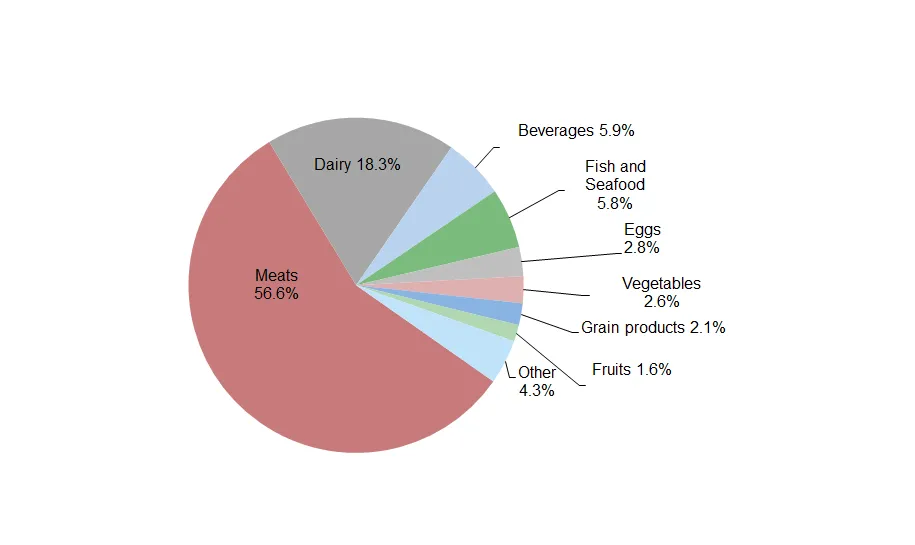
- Food accounts for 10-30% of a household's carbon footprint, typically a higher portion in lower-income households. 2 Production accounts for 68% of food emissions, while transportation accounts for 5%. 4
- Food production emissions consist mainly of CO₂, N₂O, and CH₄, which result primarily from agricultural practices. 5
- Meat products have larger carbon footprints per calorie than grain or vegetable products because of the inefficient conversion of plant to animal energy and due to CH₄ released from manure management and enteric fermentation in ruminants. 5
- Livestock emitted 195 million metric tons (Mt) CO2e of methane in 2021 from enteric fermentation, 139 Mt (71%) of it from beef cattle. 6
- In an average U.S. household, eliminating the transport of food for one year could save the GHG equivalent of driving 1,000 miles, while shifting to a vegetarian meal one day a week could save the equivalent of driving 1,160 miles. 5
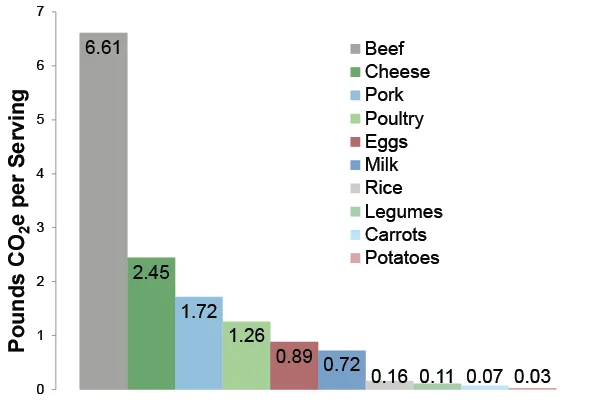
- A vegetarian diet greatly reduces an individual’s carbon footprint, but switching to less carbon intensive meats can have a major impact as well. For example, beef's GHG emissions per kilogram are 7.2 times greater than those of chicken. 7
Greenhouse Gases Contribution by Food Type in Average Diet 3
Pounds of CO2e per Serving 13 (4 oz. meat, 1/2 c. asparagus & carrots, 8 oz. liquids)
Household Emissions (See Residential Buildings Factsheet)
- For each kWh generated in the U.S., an average of 0.857 pounds of CO2e is released at the power plant.8 Coal releases 2.2 pounds, petroleum releases 2.0 pounds, and natural gas releases 0.9 pounds. Nuclear, solar, wind, and hydroelectric release no CO2 when they produce electricity, but emissions are released during upstream production activities (e.g., solar cells, nuclear fuels, cement production). 6,9
- Residential electricity use in 2021 emitted 578.3 Mt CO2e, 9.1% of the U.S. total. 6
- Space heating and cooling are estimated to account for 44% of energy in U.S. residential buildings in 2023. 10
- Refrigerators are one of the largest users of household appliance energy; in 2021, an average of 718 lbs CO2e per household was due to refrigeration. 8,11
- 26 Mt CO₂e are released in the U.S. each year from washing clothes. Switching to a cold water wash once per week can reduce household GHG emissions by over 70 lbs annually. 12
Personal Transportation (See Personal Transportation Factsheet)
- U.S. fuel economy (mpg) declined by 12% from 1988-2004, then improved by 32% from 2004-2021, reaching an average of 25.4 mpg in 2021. 14 Annual per capita miles driven increased 9% since 1995 to 9,937 miles in 2019. 15
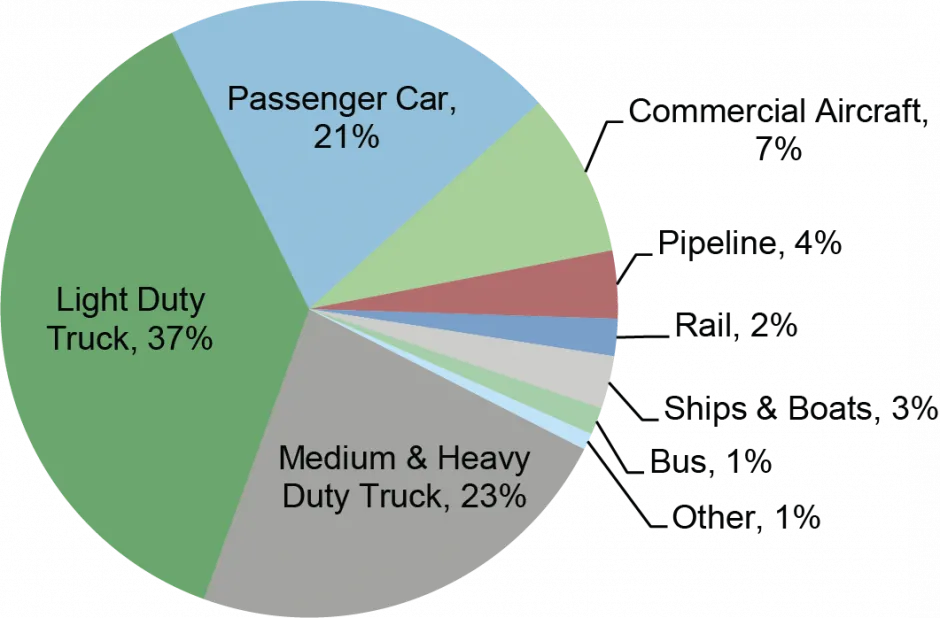
- Cars and light trucks emitted 1.05 billion metric tons (Gt) CO2e or 16.5% of the total U.S. GHG emissions in 2021. 6
- Of the roughly 66,000 lbs CO₂e emitted over the lifetime of an internal combustion engine car (assuming 93,000 miles driven), 84% come from the use phase. 16
- Gasoline releases 19.4 pounds of CO2 per gallon when burned, compared to 22.5 pounds per gallon for diesel. 17 However, diesel has 11% more BTU per gallon, which improves its fuel economy. 18
- The average passenger car emits 0.77 pounds of CO₂ per mile driven. 14
- Automobile fuel economy can improve 7-14% by simply observing the speed limit. Every 5 mph increase in vehicle speed over 50 mph is equivalent to paying an extra $0.25-$0.50 per gallon. 19
- Commercial aircraft GHG emissions vary according to aircraft type, trip length, occupancy, and passenger and cargo weight, and totaled 120 Mt CO2e in 2021. 6 In 2021, the average domestic commercial flight emitted 0.75 pounds of CO2e per passenger mile. 6,20
- Domestic air travel fuel efficiency (passenger miles/gallon) had increased 115% from 1990-2019 largely due to increased occupancy. The Covid-19 pandemic decreased this improvement to a 20% increase in fuel efficiency from 1990-2021. 20 Emissions per domestic passenger-mile decreased 44% from 1990-2019, but increased 47% from 2019-2021 due to Covid restrictions. 6,20
- In 2021, rail transportation emitted 35.2 Mt CO2e, accounting for 2% of transportation emissions in the U.S. 6
Transportation Greenhouse Gases, 2021 6
Solutions and Sustainable Actions
Ways to Reduce Carbon Footprint
- Reduce meat in your diet and avoid wasting food.
- Walk, bike, carpool, use mass transit, or drive a best-in-class vehicle.
- Ensure car tires are properly inflated. Fuel efficiency decreases by 0.2% for each 1 PSI decrease. 21
- Smaller houses use less energy. Average household energy use is highest in single-family houses (80.85 million BTU), followed by mobile homes (61.3 million BTU), apartments with 2-4 units (53.5 million BTU), and apartments with 5+ units in the building (33.7 million BTU). 11
- Whether you hand wash dishes or use a dishwasher, follow recommended practices to decrease water and energy use and reduce emissions. 22
- Energy consumed by devices in standby mode accounts for 5-10% of residential energy use, adding up to $100 per year for the average American household. Unplug electronic devices when not in use or plug them into a power strip and turn the power strip off. 23
- Choose energy-efficient lighting. Switching from incandescent to LED light bulbs saves an average household more than $200/year. 24,25
- Reduce what you send to a landfill by recycling, composting, and buying products with minimal packaging.
- Purchase items with a comparatively low carbon footprint. Some manufacturers have begun assessing and publishing their products’ carbon footprints.
- Covering 80% of roof area on commercial buildings in the U.S. with solar reflective material would conserve energy and offset 125 Mt CO₂ over the structures’ lifetime, equivalent to turning off 34 coal power plants for one year. 26,27
- Replacing the global fleet of shipping containers’ roof and wall panels with aluminum would save $28 billion in fuel. 28
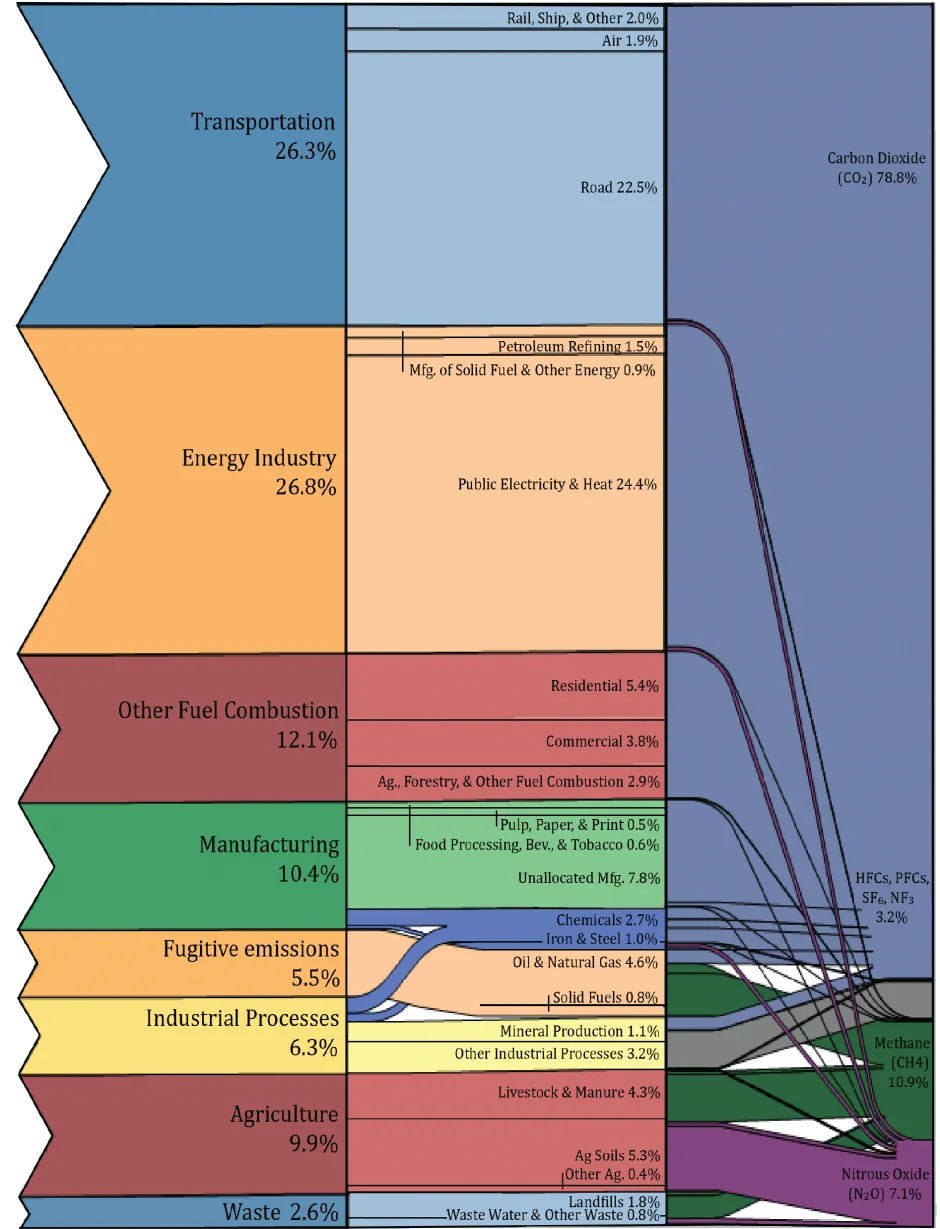
U.S. Greenhouse Gas Emissions, 2020 29
Carbon Footprint Calculator
Estimate your personal or household greenhouse gas emissions and explore the impact of different techniques to lower those emissions:
- U.S. Environmental Protection Agency: www.epa.gov/carbon-footprint-calculator/
- The Nature Conservancy: www.nature.org/greenliving/carboncalculator/
- Global Footprint Network: https://www.footprintcalculator.org/
Center for Sustainable Systems, University of Michigan. 2023. "Carbon Footprint Factsheet." Pub. No. CSS09-05.
References
- The Carbon Trust (2018) Carbon Footprinting.
- Jones C., Kammen D. (2011) "Quantifying Carbon Footprint Reduction Opportunities for U.S. Households and Communities."
- Heller, M.C., et al. (2018). Greenhouse gas emissions and energy use associated with production of individual self-selected US diets. Environmental Research Letters, 13(4), 044004.
- Boehm R., et al. (2018) "A Comprehensive Life Cycle Assessment of Greenhouse Gas Emissions from U.S. Household Food Choices."
- Weber, C. and H. Matthews (2008) "Food miles and the Relative Climate Impacts of Food Choices in the United States." Environmental Science & Technology, 42(10): 3508-3513.
- U.S. Environmental Protection Agency (EPA) (2023) Inventory of U.S. Greenhouse Gas Emissions and Sinks 1990 - 2021.
- Heller, M., et al. (2020). Implications of Future US Diet Scenarios on Greenhouse Gas Emissions.
- U.S. EPA (2023) “Emissions & Generation Resource Integrated Database (eGRID) 2021.”
- U.S. Energy Information Administration (EIA) (2023) Electric Power Monthly with Data from January 2023.
- U.S. EIA (2023) Annual Energy Outlook 2023.
- U.S. EIA (2023) Residential Energy Consumption Survey 2020.
- Mars C. (2016) Benefits of Using Cold Water for Everyday Laundry in the U.S.
- Heller, M. and G. Keoleian. (2014) Greenhouse gas emissions estimates of U.S. dietary choices and food loss. Journal of Industrial Ecology, 19 (3): 391-401.
- U.S. EPA (2023) The 2022 EPA Automotive Trends Report: Greenhouse Gas Emissions, Fuel Economy, and Technology since 1975.
- U.S. Department of Energy (DOE), Oak Ridge National Lab (2022) Transportation Energy Data Book: Edition 40.
- Pero, F. et al. (2018) Life Cycle Assessment in the automotive sector: a comparative case study of Internal Combustion Engine and electric car.
- U.S. EIA (2022) “Carbon Dioxide Emissions Coefficients.”
- U.S. DOE, Alternative Fuels Data Center (2015) “Fuel Properties Comparison Chart.”
- U.S. DOE, Office of Energy Efficiency and Renewable Energy (EERE) (2023) “Driving More Efficiently."
- U.S. Department of Transportation Bureau of Transportation Statistics (2022) National Transportation Statistics 2022.
- U.S. DOE, EERE (2016) "Gas Mileage Tips: Keeping Your Car In Shape."
- Porras, G. (2019) Life Cycle Comparison of Manual and Machine Dishwashing in Households
- U.S. DOE (2012) “3 Easy Tips to Reduce Your Standby Power Loads.”
- Liu, L., Keoleian, G. A., & Saitou, K. (2017). Replacement policy of residential lighting optimized for cost, energy, and greenhouse gas emissions. Environmental Research Letters, 12(11), 114034.
- Department of Energy (2023) Energy Saving Hub.
- Levinson, R. (2012) The Case for Cool Roofs. Lawrence Berkeley National Laboratory, Heat Island Group.
- U.S. EPA (2022) “Greenhouse Gas Equivalencies Calculator.”
- Buchanan, C., et al (2018) “Lightweighting shipping containers: Life cycle impacts on multimodal freight transportation.” Transportation Research Part D 62:418-432.
- U.S. EPA (2020) 2020 Common Reporting Format (CRF) Table.
